DATA SCIENCE

DATA SCIENCE

Data science is an interdisciplinary field that uses scientific methods, processes, algorithms and systems to extract knowledge and insights from structured and unstructured data, and apply knowledge and actionable insights from data across a broad range of channels and sources.
Applying data science to digital marketing allows me to offer additional levels of insight, depth and data which increases sales, customers and profits, whilst reducing costs and wastage.
CASE STUDIES

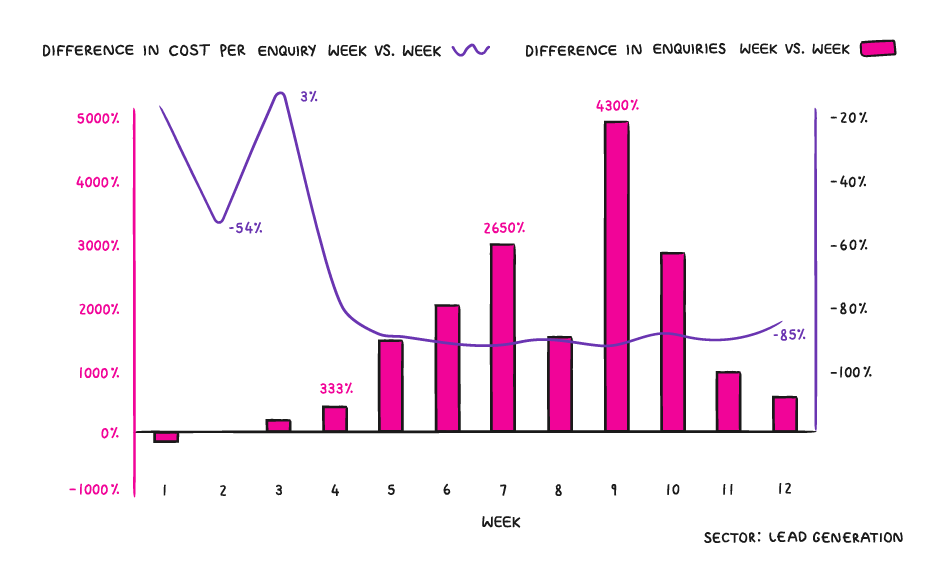
+4,300% INCREASE IN ENQUIRIES & -96% REDUCTION IN COST PER ENQUIRY (YOY) – LEAD GENERATION

As we can see within the graph, the first couple of weeks saw a slight dip in performance, as our newly deployed scripts started making changes across thousands of keywords. During week 3 we started to see some positive results, with a +120% increase in enquiries YoY, which then grew to +2,650% increase in enquiries and then a whopping 4,300% increase YoY.

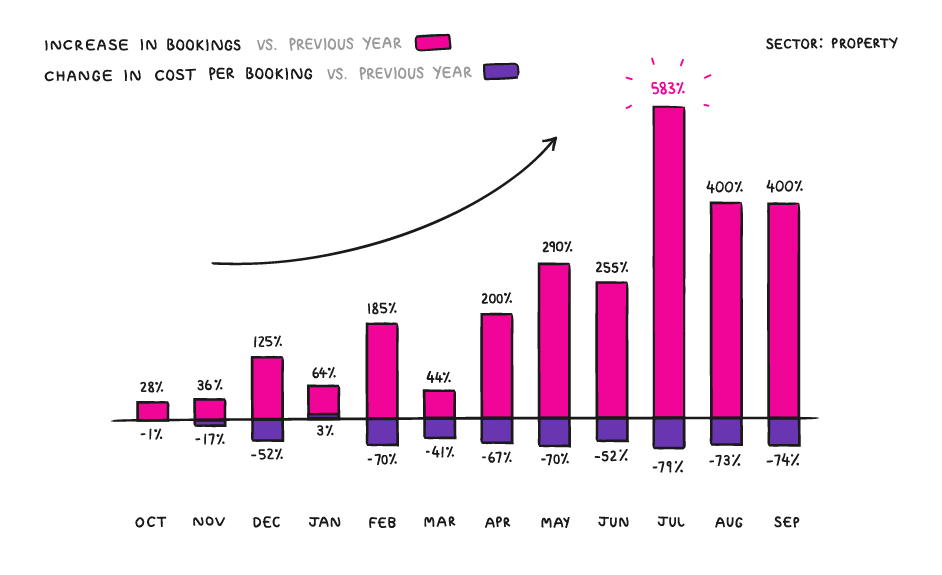
+583% INCREASE IN BOOKINGS & -78% DECREASE IN COST PER BOOKING (YOY) – LEAD GENERATION

Within the first 5 months we were able to achieve a +185% increase in bookings with a 69% decrease in cost por booking (vs. the same month during the previous year). And by month 10 we saw a staggering +583% increase in bookings with an overall 78% decrease in cost per booking. Conversions & costs are measured across all managed channels.

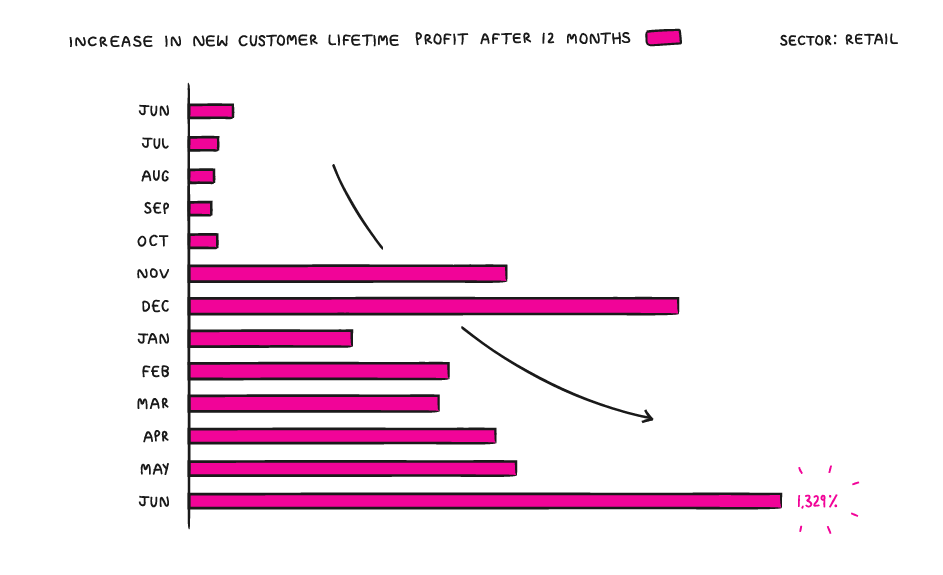
+1,329% INCREASE IN NEW CUSTOMER LIFETIME PROFIT (YOY) – RETAIL

This approach allowed us to re-engage with existing cold, warm and hot audiences across channels, significantly increasing repeat order rates via engaging content and ads which enticed the users to return to the website and carry out additional purchases online, resulting in a massive 1,329% increase in profit when comparing the 12 months from June 2019 to the 12 months from June 2018.

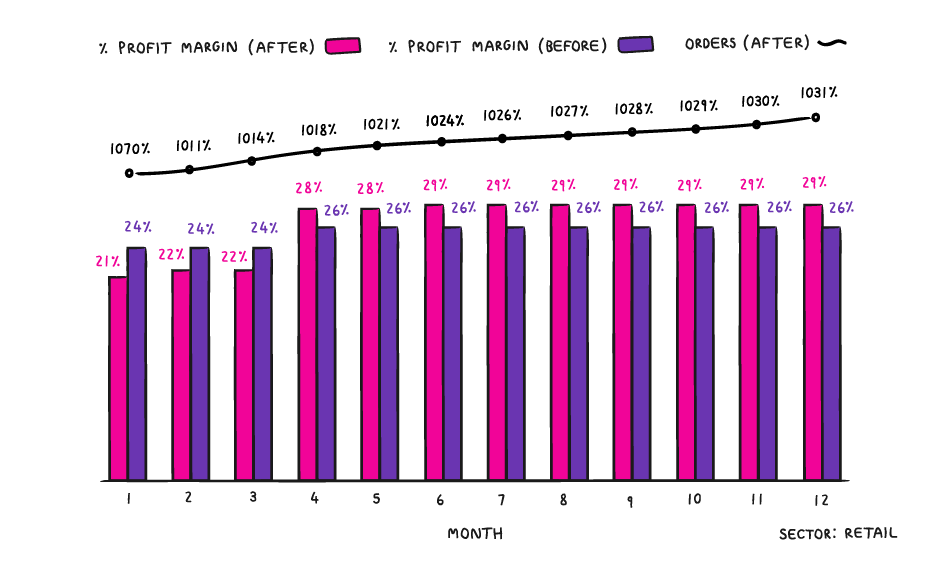
10X INCREASE IN ORDERS (YOY) – RETAIL

By applying an integrated approach to our activity, we were eventually able to generate a 10X increase in new customer orders vs. the previous year. The above “New Customer Orders (After) graph represents first orders from new customers + the increase in repeat orders over the following 12 months (lifetime value), meaning that: when we combine the volume of new customers acquired, initial order volume plus the repeat orders they carried out over a 12-month period, this was equal to a 10X increase in orders vs. the same month during the previous year.

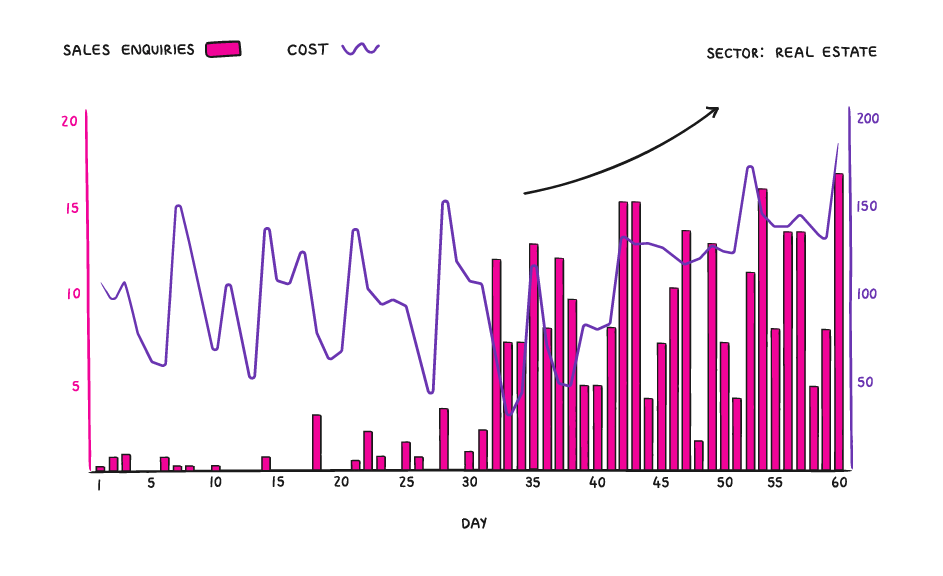
+1,596% INCREASE IN SALES ENQUIRIES & -93% REDUCTION IN CPA – LEAD GENERATION

The graphs shown represents sales enquiries 30 days pre & post our new campaign launch. Our campaign was launched on day “30” within the graph, and as we can see this resulted in a huge increase in daily enquiries from there onwards, equal to a +1,596% increase in sales enquiries and a 93% reduction in cost per enquiries when comparing the two 30-day periods.

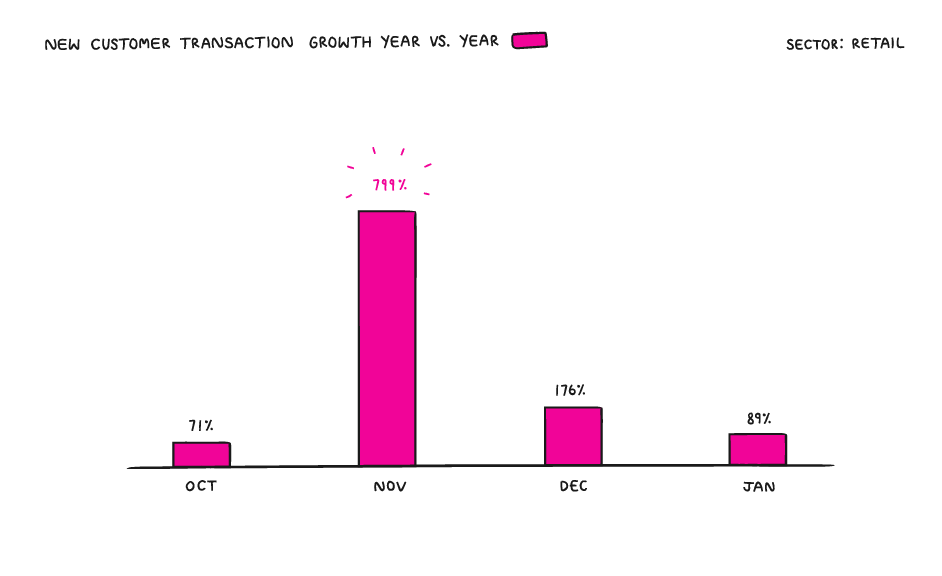
+799% INCREASE IN NEW CUSTOMER TRANSACTIONS DURING BLACK FRIDAY (YOY) – ECOMMERCE

This strategy allowed us to generate a +799% increase in new customer transactions YoY during the key Black Friday period, skyrocketing sales and new customer volumes that would become loyal customers in the months and years to come.