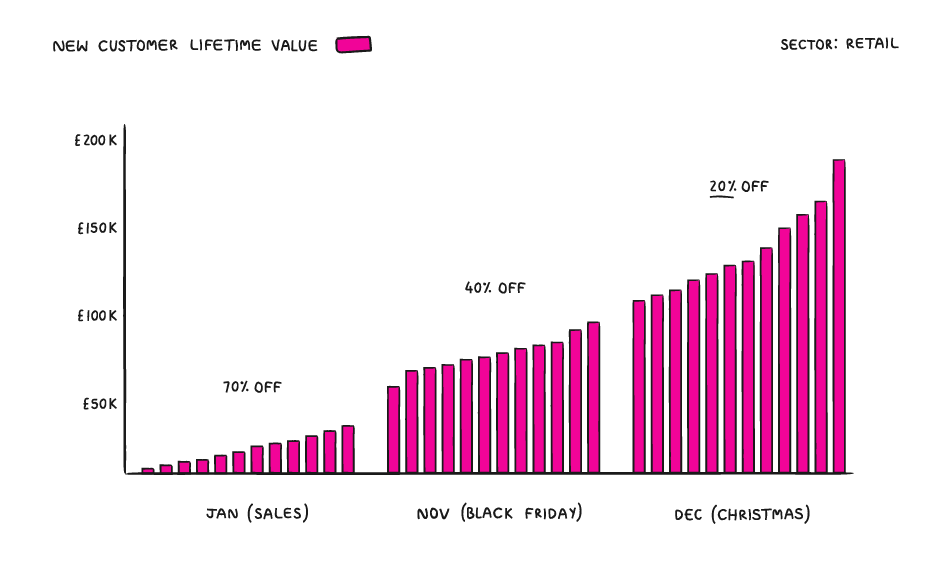
We wanted to identify new customer lifetime value by month/sale period. As with most retailers, the majority of revenue and transactions takes place during November, December and January, due to these being significant sale periods. We knew revenue and transactions increased during these periods, but we also wanted to know what happened to customer lifetime value when acquiring customers at such discounted rates.
The featured graph shows us the lifetime value (in profit) between months 1 and 12, for the groups of customer acquired during each specific sale period. In order to do this we needed to identify how much profit new customers generated during month 1 (November, for example), and then track repeat orders, and the profit of these, over the following 12 month period, across all channels.
What this showed us is that, whilst January Sale customers saw the biggest % increase in profits over the months (growing by +1,107% over the 12 month period), the volume of actual profit £ (money in the bank) was far smaller proportionately when comparing to November (which grew by +72%) and December (growing by +82%) periods, due to the higher margin obtained during these months. This led to the brand being able to make more tactical, data-based decisions when launching sales over the year.